-
MetaTrader 4 Brokers
The top MT4 brokers in AU
-
MetaTrader 5 Brokers
The best MT5 brokers in AU
-
TradingView Brokers
The best TradingView brokers
-
cTrader Brokers
The top cTrader brokers in AU
-
Forex Trading Apps
Trade on the go from your phone
-
Copytrading Brokers
Copy professional traders
-
All Trading Platforms
Find a platform that works for you
Gold prices have suffered a setback of late, but this cannot disguise the extraordinary bull run the precious metal has been on since the beginning of October 2023.
Before Hamas invaded Israel on October 7th, 2023, gold had been in the doldrums for some time, and the price was sitting at 1820 USD per troy ounce. Global demand, which had been propped up by Chinese retail investors and central bank buying, was very weak—mainly due to USD strength, which had been on a three-month-long bull run since the end of the summer.
The surprise outbreak of conflict in the Middle East changed everything. As I wrote in my overview of the conflict’s effects on commodities last year, gold benefited strongly from its status as a haven asset in those early weeks of the war. It was also around this time that markets started to believe that the Fed’s war on inflation was ending, weakening the USD. The weaker USD, combined with the spectre of a wider Middle East conflict, turbocharged demand for gold, with prices climbing to over 2000 USD by the end of October.
As 2023 drew to a close, the potential for a wider conflict in the Middle East seemed to fade, though the weaker dollar continued to support gold prices, which peaked at over 2080 USD at the end of December.
Early 2024 saw gold prices stuck in a range, much like the currency markets. Optimism for lower interest rates in the US faded as data showed that inflation remained sticky and the wider US economy was in remarkable health. The conflict in the Middle East, while showing no signs of abating, had not evolved into a wider war. But the price refused to fall much below the 2000 USD mark, as Chinese demand and Israel’s assertive response to the Hamas invasion continued.
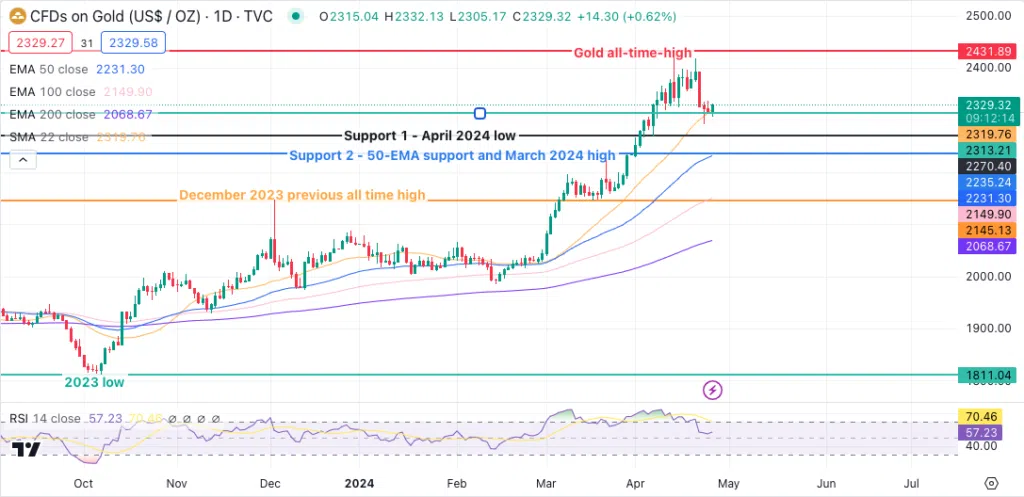
But since February this year, gold has resumed its remarkable ascent – more remarkable as it has continued to rise in the face of a strong US dollar. Initially driven by speculation and governmental and institutional demand, the bull run picked up steam in April when Iran was drawn into direct conflict with Israel. Gold prices hit an all-time high of 2431 USD on April 12th.
Price has fallen since then, with a lull in the Middle East conflict providing a backdrop. USD strength also seems to be hitting demand. But given the unprecedented nature of gold’s recent price movement, it’s increasingly difficult to bet against a further increase in price.
FBS recently published an article from its analytical team arguing that gold prices could break 2800 USD this year, citing “significant central bank buying, continued inflationary pressures in the global economy, and increased demand for gold from non-institutional investors”. While I believe 2800 USD is fanciful, I am also wary that I may be forced to eat my words come year end.
Much will depend on the future of the conflict in the Middle East and wider geopolitical tensions. As long as retail, governmental, and institutional investors remain wary of riskier assets, we can expect gold prices to remain elevated. The strength of the dollar will also play a factor. If the Federal Reserve finds itself in a position to significantly lower interest rates this year, an unlikely scenario, this will also support the price.
Technical Analysis
Having fallen from its all-time high over the past two weeks, gold appears to have entered a consolidation phase, resting on the 20-EMA support at the 2319.83 USD level. Riding high above all moving averages (20, 50, 100, and 200-day EMAs), the precious metal still appears to have potential for further upside moves. The RSI confirms this bias, having moved out of oversold territory but still sitting above 50.
On the upside, gold may face resistance at the 2356 USD level, and beyond that, it may be difficult to push past the all-time high of 2431 USD.
On the downside, immediate support will be faced at the April 2024 low of 2270 USD level, and below that at the intersection of the March 2024 high and the 50-EMA support at the 2235 USD level.
Stay updated
This form has double opt in enabled. You will need to confirm your email address before being added to the list.


