


Page Navigation


Select a different country or region to view content tailored to your location.


<p>Alison Heyerdahl is the Head of Content at FxScouts, a Chartered Market Technician (CMT), and an experienced trader, as well as a financial writer with extensive expertise in Forex trading, broker analysis, and market research. She has reviewed 100+ brokers, publishes weekly YouTube trading videos, and co-hosts the “Let’s Talk Forex” podcast.</p>


The Double-top pattern is a reversal trading pattern that signals the end of a bullish trend and the start of a new bearish trend. As the name suggests, the double top appears at the end of an uptrend. There is also an inverted version of the double top that appears at the end of a downtrend which is called the double bottom pattern.
The double top and double bottom patterns work on the same technical principles. The double top happens very frequently and are very reliable trading patterns to identify and lead to possible trend reversals.
To trade these patterns effectively the trader must:
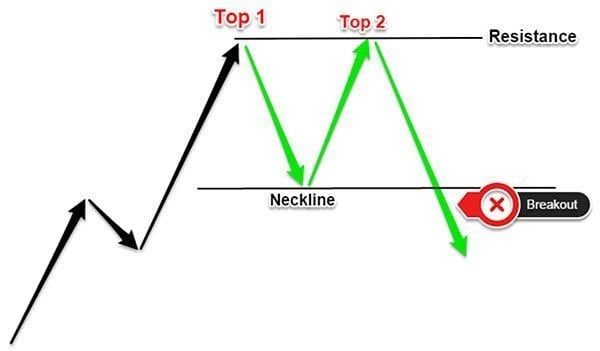
The double top is constructed by two consecutive highs. The standard double top pattern consists of three major elements.
If the double top pattern is something you want to incorporate into your own trading, then you need to train your eyes to spot the shape you see in the image below:
Once you see the patterns, you need to know how you can enter, place your stop and place the target for the double top reversal pattern.
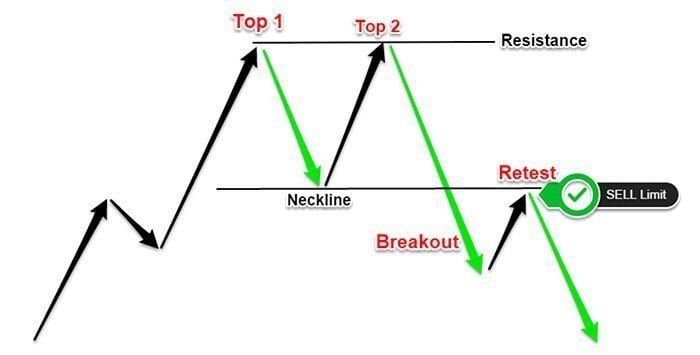
The double top is a versatile reversal pattern that presents two ways you could possibly trade this pattern. Both ways require waiting for the double top to be confirmed by the market. We don’t want to anticipate this price formation, but instead, we want this pattern to build itself.
The standard entry strategy for the double top is to wait for a break and a close below the neckline before selling. A more aggressive approach is to sell once we break below the neckline without waiting for confirmation. Alternatively, you can use a more conservative approach and wait for a break and a retest of the neckline before selling. You can do this by simply placing a sell limit order near the neckline.
Momentum is the fuel of prices thus if we have a violent reaction lower from the first and the second peaks, the more energy the price has to break below the neckline and go much lower. When analyzing the double top pattern, it’s important to gauge the momentum activity because it will tell you if there is enough supply to outpace demand.
The way the double tops (double bottoms) work is that after the break the price tends to travel the same price distance that can be measured from the neckline to the top. This should give us a fairly realistic expectation of how far the price should travel to the downside and thus a very productive exit strategy.
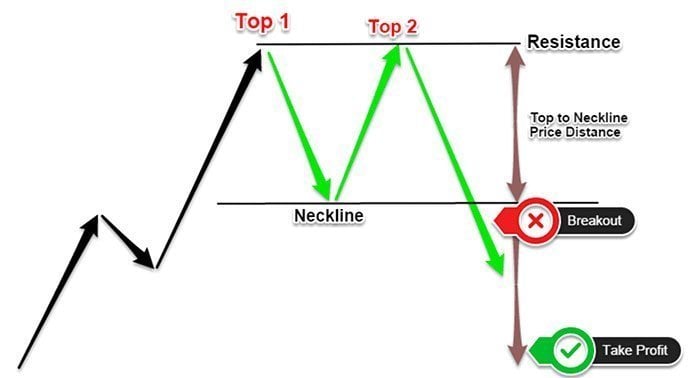
The double top price structure also offers us with a very logical place to hide our protective stop loss. The ideal place to hide your stop loss is above the two peaks. A break above this resistance level will automatically invalidate the double top pattern.
Let’s now look through some real chart examples of the double top pattern from my trading.
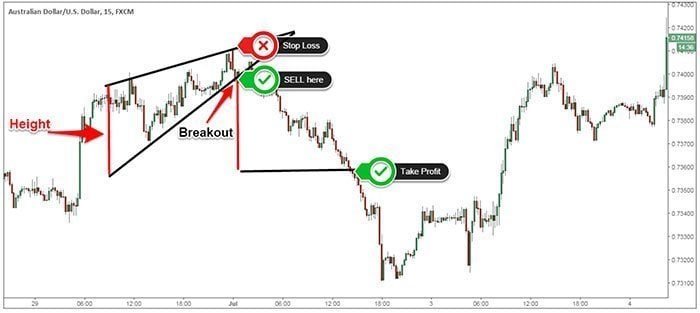
The AUD/USD 15-minute chart below highlights a perfect double top reversal pattern that reaches the profit target before returning to the previous trading range.
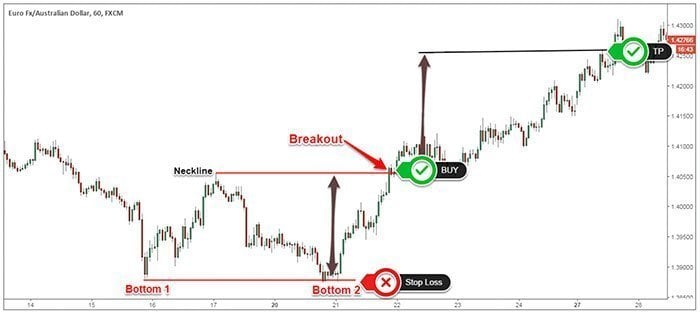
An example of the double bottom pattern, which is the inverted version of the double top pattern, can be seen in the figure below:
When trading double top reversal patterns you have to keep in mind that you need to have a confirmed bullish trend otherwise you won’t have enough profit to make the pattern work for you. Not all double tops are created equal, so we want to only trade those double tops that offer a bigger risk to reward ratio.
Curious about the latest in forex? You’re not alone. Many traders and investors are digging deeper into these topics to refine their strategies and understanding. Here’s a curated selection of “others also viewed” articles, offering a range of perspectives and insights that could prove valuable for your own forex journey.

Good Forex brokers for beginners will help their clients get started. These are the best Forex brokers for beginners in Australia for 2026.

Which broker offers the lowest spreads? We compare Forex spreads across 160+ regulated Forex brokers accepting Australian clients using the latest data.

Find the best brokers for trading the VIX, offering precise execution, low fees, and advanced tools to capitalise on market volatility.
Partner Manager and Financial Writer
Head of Content
Financial Writer