


Page Navigation


Select a different country or region to view content tailored to your location.


Chris manages the relationships with our partners to provide the best Forex trading experience possible for our users. Chris has 15+ years of research, and editorial and design experience for political and financial publications. His background has given him a deep understanding of international financial markets and the geopolitics that affect them.

Reading Forex chart patterns is synonymous with technical analysis, a trading strategy often used by experienced day traders. Technical analysis requires education and trading experience to understand; however, traders can use chart pattern recognition software that highlights chart patterns and help traders draw trading conclusions.
With experience, traders will learn to identify them in real time and see them as trading opportunities.
A chart pattern is a graphed configuration of reoccurring price movement. In other words, chart patterns, or price patterns, are a pictorial representation of the buying and selling pressure that goes on the market. The shape of the graph is what differentiates one pattern from another.
The action of trading based on price patterns is what we refer to trading patterns.
The chart patterns give the chart a voice, and behind every single chart pattern, there is a story of what is happening. For example, if we see a long upper wick at the top of an uptrend with some high volume, we know there is a lot of profit-takings, and we can anticipate that the bears are going to start to show up.
Trading based on chart patterns should not be done in isolation without consideration of what the rest of the market is doing. You need to have other supporting factors that validate the trade signals; otherwise your predictions will be inconsistent.
We can distinguish two different types of chart patterns:
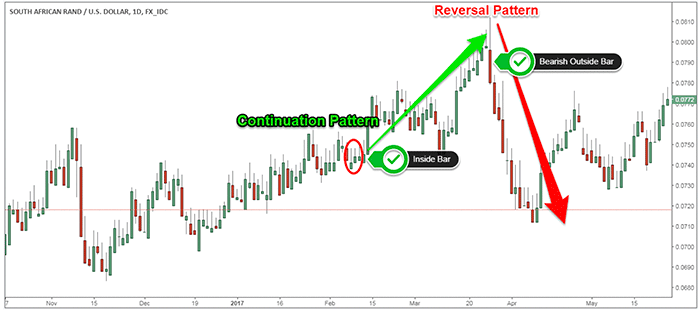
Due to the fractal nature of the markets, the same chart pattern can work in different time frames, and it can perform both as a continuation and a reversal pattern. It all depends on the location of the pattern relative to the trend direction.
The most popular continuation patterns include:
The most popular reversal patterns include:
If you want to learn how to recognise chart patterns, strategies of how to trade them, and some real trading examples, then please click on the links above and read about each one of them more in-depth
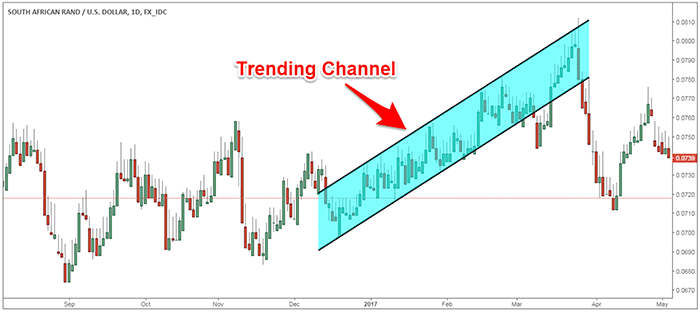
According to the chart theory, we can go one step further and make the distinction between trending patterns such as channels, and non-trading patterns like triangles. The support and resistance levels that form the channel are parallel, effectively creating a mini-trend, while in a triangle the price gets squeezed into a tighter and tighter range.
Trading based on chart patterns has its limitations because it doesn’t tell you the trend, and how the market has moved over a particular period. For example, the pin bar, which is the most basic reversal pattern, is only the action of a single bar.
To trade successfully in the Forex market, you need to keep the chart pattern in a much broader context. You need to read the whole story behind the chart pattern and ask questions about the trend, support and resistance levels, previous swing high/low, momentum readings, overbought and oversold conditions and more.
Chart patterns are among the most useful tools in technical analysis as they make short and long-term forecasts. Because markets are fractal, these chart patterns work across all time frames, and because trader psychology is the main driving force of price action, these chart patterns work across all asset classes starting from stocks, bonds, currencies and cryptocurrencies.
Technical traders believe the price reflects all the fundamental information, including market sentiment and perceived fair value. If this is true, then chart patterns should be the ultimate predictor of future market movement.
Chart patterns need to be analysed in the context of the trend which is key to successfully trading chart patterns. Determining the dominant trend is paramount because only then can we use chart patterns to know whether the current trend is more likely to continue or more likely to reverse.
To better understand why chart patterns work, it’s important to look at the psychology behind the price and the supply and demand forces that give these chart patterns their shapes.
The basis of chart patterns is market psychology because these price formations reflect the buying and selling pressures in a visual format. The supply and demand forces are the ones that shape these price patterns. So, a chart can give us a complete pictorial record of all trading activity and can provide us with a framework to analyse the battle raging between the bulls and the bears.
Most importantly, chart patterns can assist us in finding out who is winning the bulls and bears battle. Trading is all about determining who is winning this battle because this will allow you to take trades according to the market sentiment.
No matter the time frame you use to trade these chart patterns, they still work because emotion and supply and demand are universal laws. So, what gives the shape to a price chart is the buy and sell orders or the supply and demand forces since orders are submitted by human beings, to get a sense of the price you need to read the charts through a lens that shows what other market participants are thinking.
Every chart pattern has a story that creates the current shape of the pattern. For example, a bullish flag shows that the bulls are not buying anymore, but they hold and defend their positions by keeping the price in a narrow range. Flag patterns are a powerful price action because it incorporates the trend in the price structure.
A top-down approach to trading chart patterns incorporates three main steps.
Trading based on chart patterns is merely a technique or a tool that you can use in your trading to help you make better trading decisions and to better time the market.
Chart patterns give you a way to read the charts and can help you identify profitable trading opportunities. It’s important to focus and master one chart pattern at a time. Take it slow and make sure you’re absorbing all the information that the chart pattern is trying to tell you before committing to the trade.
Curious about the latest in forex? You’re not alone. Many traders and investors are digging deeper into these topics to refine their strategies and understanding. Here’s a curated selection of “others also viewed” articles, offering a range of perspectives and insights that could prove valuable for your own forex journey.
Good Forex brokers for beginners will help their clients get started. These are the best Forex brokers for beginners in Australia for 2026.

Which broker offers the lowest spreads? We compare Forex spreads across 160+ regulated Forex brokers accepting Australian clients using the latest data.

Find the best brokers for trading the VIX, offering precise execution, low fees, and advanced tools to capitalise on market volatility.
Partner Manager and Financial Writer
Head of Content
Financial Writer