


Page Navigation


Select a different country or region to view content tailored to your location.


Chris manages the relationships with our partners to provide the best Forex trading experience possible for our users. Chris has 15+ years of research, and editorial and design experience for political and financial publications. His background has given him a deep understanding of international financial markets and the geopolitics that affect them.

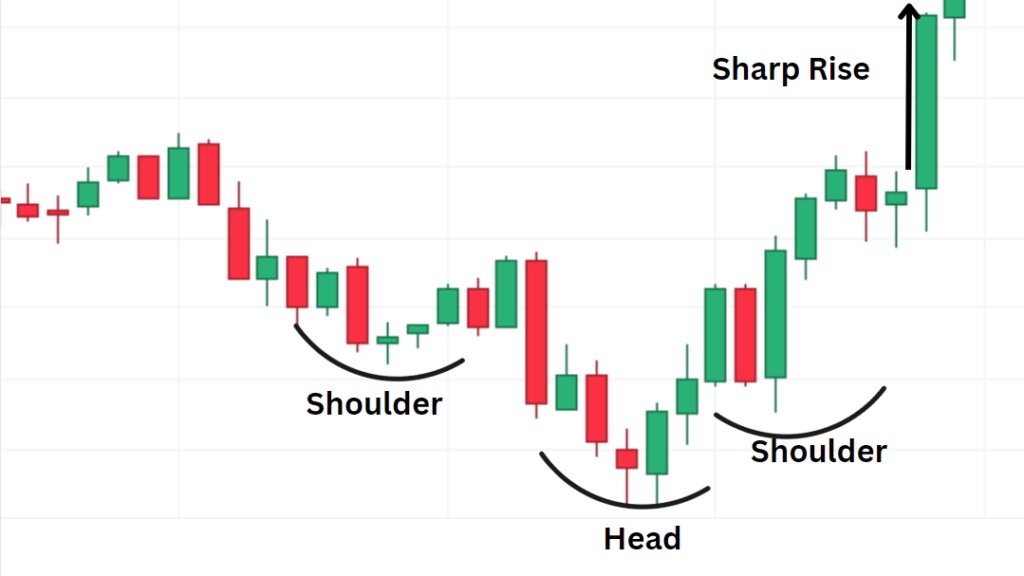
The head and shoulders pattern is a multi-candlestick formation, much like the bull flag, another multi-candlestick pattern. It generally signals the potential for a breakout and is a more accurate indicator when viewed across longer timeframes.
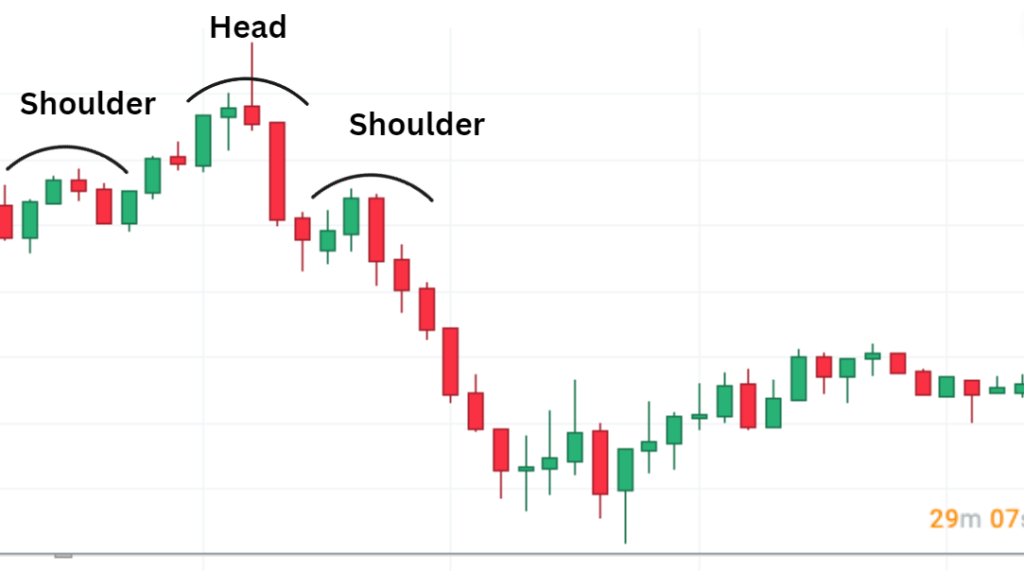
As displayed above, the head and shoulders pattern may not be perfectly aligned, but approximations often suffice with such patterns. We can identify the left shoulder, the head, and the right shoulder.
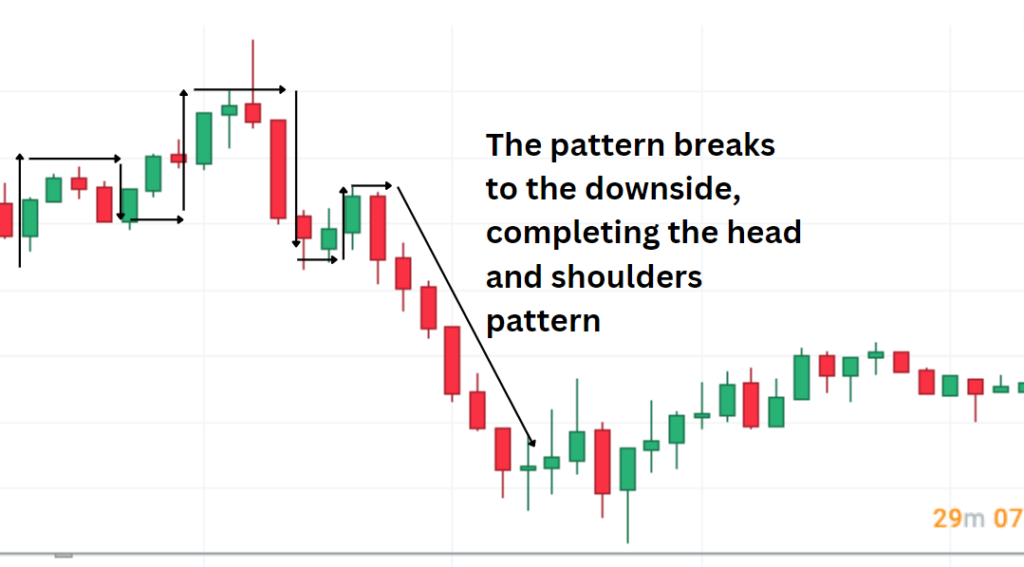
Essentially, the security moves upward, consolidates, rises again with a subsequent consolidation, and eventually declines. While many traders anticipate a retest of the previous high and set up buy orders, more often than not, the price decreases, completing the head and shoulders pattern.
The Inverted Head and Shoulders pattern
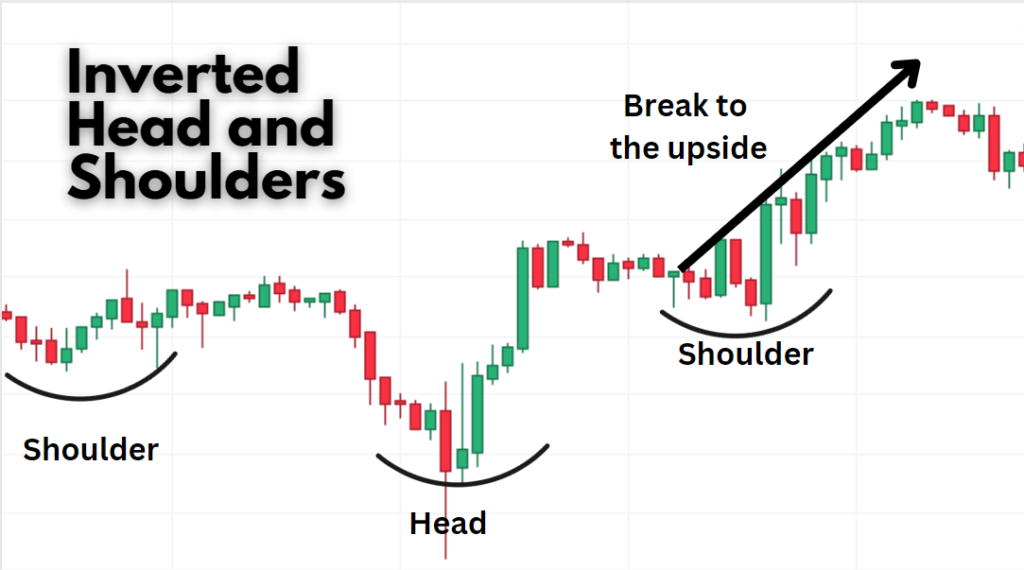
Conversely, if we invert the pattern, as demonstrated above, we have an inverted head and shoulders, indicating an opportune time to consider buying.
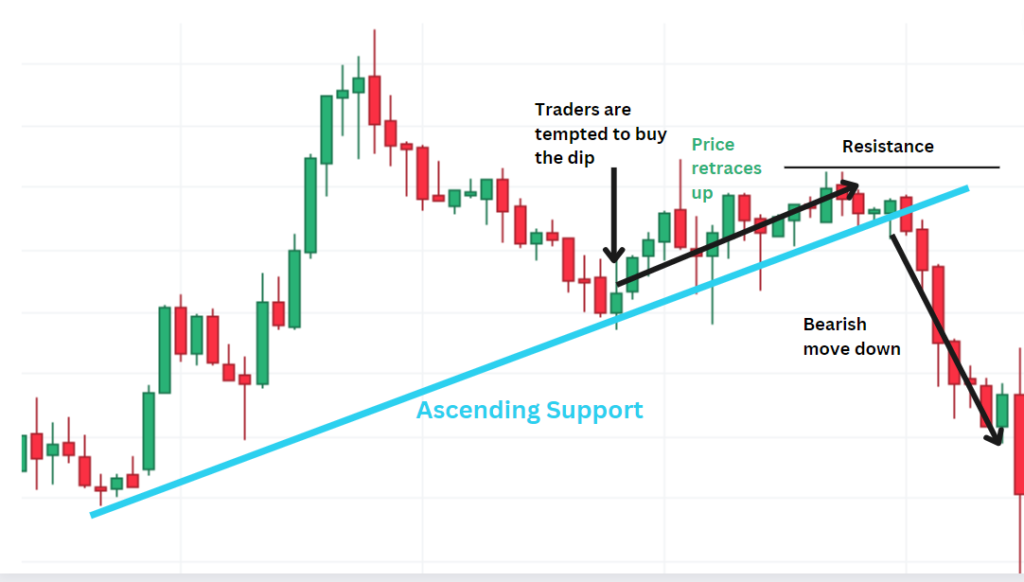
Returning to our charts, we may observe what appears to be an ascending support level, tempting traders to buy during the dip. However, the subsequent price action, marked by resistance, signals a bearish sentiment.
Here are a few more examples:
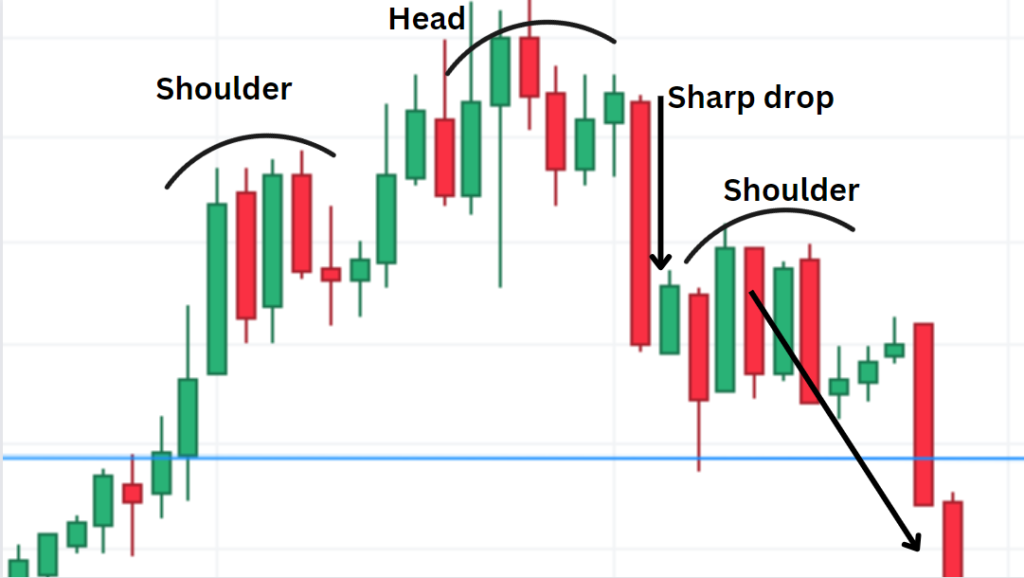
In this case, the formation of the shoulder is followed by a slight pullback and a subsequent ascent, followed by a sharp decline below the previous support. The key takeaway is to watch for that significant drop.
An inverted head and shoulders, although sometimes harder to spot, can also be powerful. In this scenario, we notice a shoulder rallying briefly before dipping into the formation of the head. A sharp rise above the previous resistance level, followed by consolidation and continued upward movement, completes the pattern.
When to Trade the Head and Shoulders Pattern
Head and shoulders formations serve as potent buy and sell signals. However, trading them when market volume is high is advisable, indicating multiple participants looking for the same signals.
Additionally, ensure that fundamental factors align with your trading decisions, such as interest rate announcements or inflation rate reports. Trading in the direction of the long-term trend also enhances safety. These patterns tend to yield better results on actively traded instruments with catalysts driving their movement.
Confirmation with Indicators
Don’t forget to look for supplementary indicators to validate your analysis.
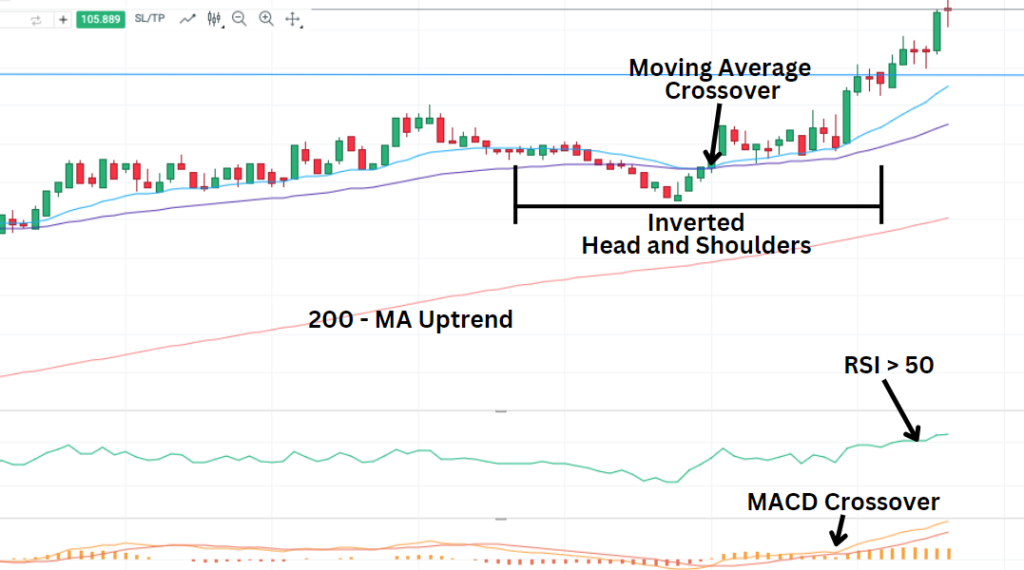
For instance, in the case of the Dollar Index illustrated above, we observe an inverted head and shoulders pattern, supported by a bullish move after the head formation. Other indicators, such as moving average crossovers, MACD crossovers, and RSI levels above 50, further confirm the upward trend. Consistency across multiple timeframes is another positive sign. Spotting a bullish signal on a shorter timeframe, followed by a matching pattern on a longer timeframe, it strengthens your trade's potential success.
Conclusion
In conclusion, head and shoulders patterns are valuable tools for traders, but they should be used judiciously, with attention to market conditions, fundamentals, and additional indicators. For any questions or inquiries, please feel free to reach out to us.
Curious about the latest in forex? You’re not alone. Many traders and investors are digging deeper into these topics to refine their strategies and understanding. Here’s a curated selection of “others also viewed” articles, offering a range of perspectives and insights that could prove valuable for your own forex journey.

Good Forex brokers for beginners will help their clients get started. These are the best Forex brokers for beginners in Australia for 2026.

Which broker offers the lowest spreads? We compare Forex spreads across 160+ regulated Forex brokers accepting Australian clients using the latest data.

Find the best brokers for trading the VIX, offering precise execution, low fees, and advanced tools to capitalise on market volatility.
Partner Manager and Financial Writer
Head of Content
Financial Writer